If you track the occasion that brought a customer into your store, the By Why In report can help track such activity and help plan promotions, postcards, and other targeted marketing. For more about report filters and settings, see the section entitled Creating a Report.
|
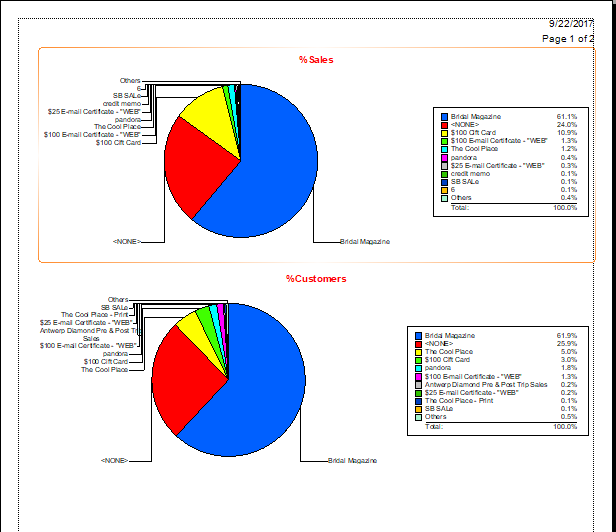
Pie Chart Data |
| ||
|
|
% Sales |
Percent of sales by type of Why In? | |
|
|
% Customers |
Percent of customers by type of Why In? | |
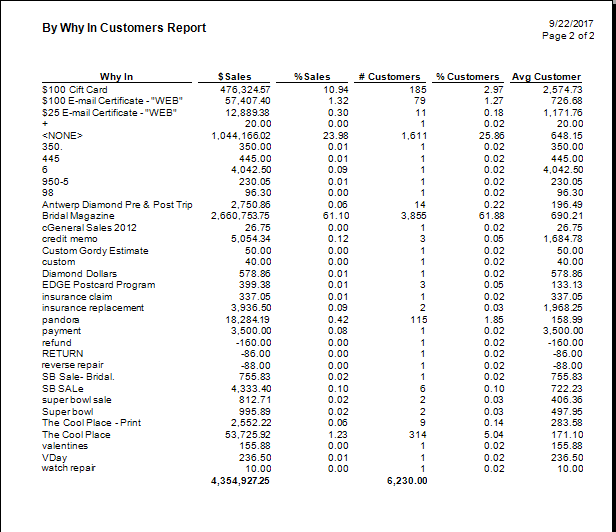
Data fields in the By Why In report include:
|
Why In |
Lists promotional events. |
|
$ Sales |
The amount of sales produced by each promotional event. |
|
% Sales |
The percent of sales produced by each promotional event. |
|
# Customers |
The number of customers who came in because of the promotional event. |
|
% Customers |
The percent of customers who came in because of the promotional event. |
|
Avg Customer |
On average, the amount customers spent as a result of their visit. |