To create a new Dashboard:
1.
Click Dashboards > Add.
|
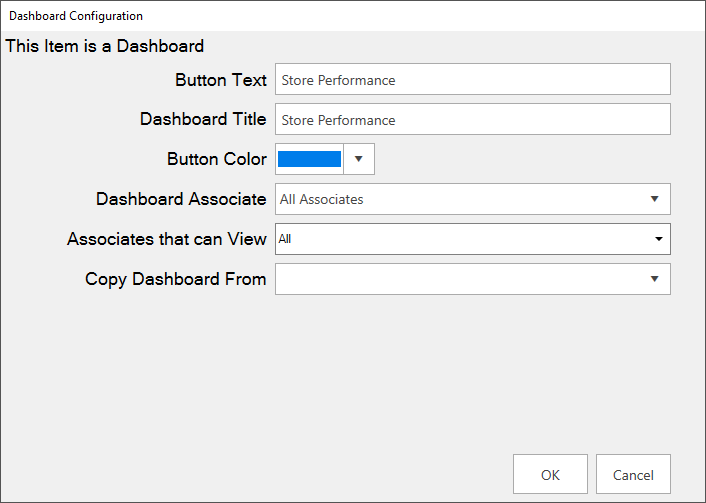
Button Text |
Label for the button; each Dashboard will show as its own button in the menu |
|
Dashboard Title |
Title that displays at top of Dashboard |
|
Button Color |
Color for this Dashboard’s button |
|
Dashboard Associate |
Associate that this Dashboard’s data is based on |
|
Associates that can View |
Associates that have permission to view this Dashboard |
|
Copy Dashboard From |
Copy initial Dashboard setup from an existing one |
2. All fields, with the exception of Copy Dashboard From, are required. Fill them in and click OK. The Dashboard Management window will appear.
3. This window controls the positioning of the buttons in the hierarchy. See the Dashboard Management section of this document for more information. For now, click Save/Close in the lower right.
4.
Your Dashboard button will appear on the left.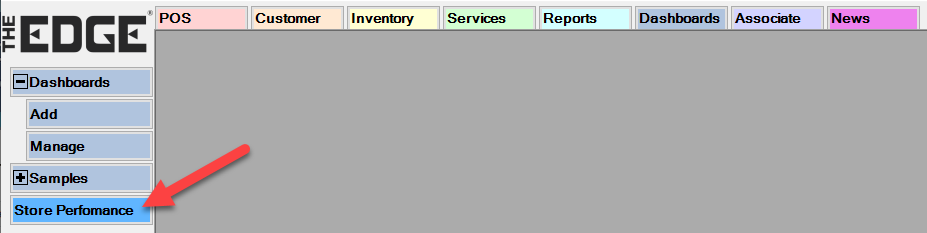
5.
Click on the button you just created. The blank dashboard will load.
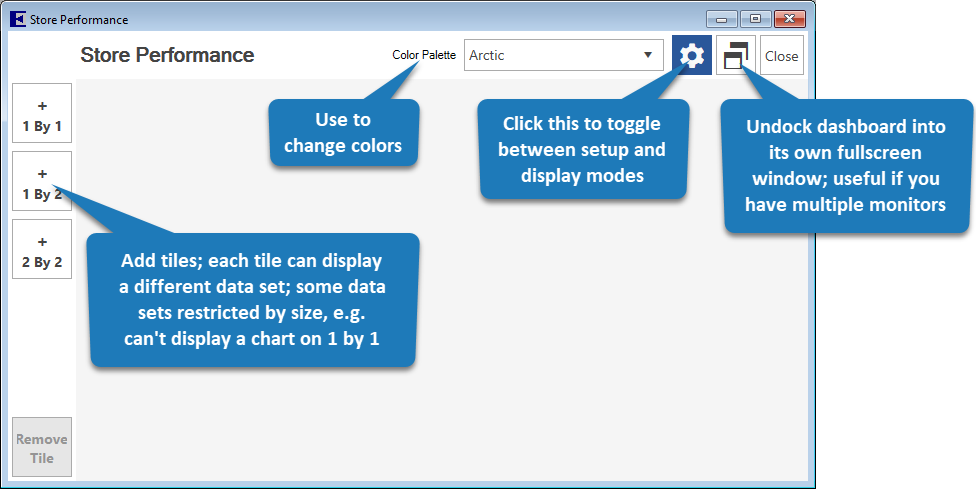
6.
Click 2 by 2 to create your first tile, then click the Gear icon
on the tile to enter setup. 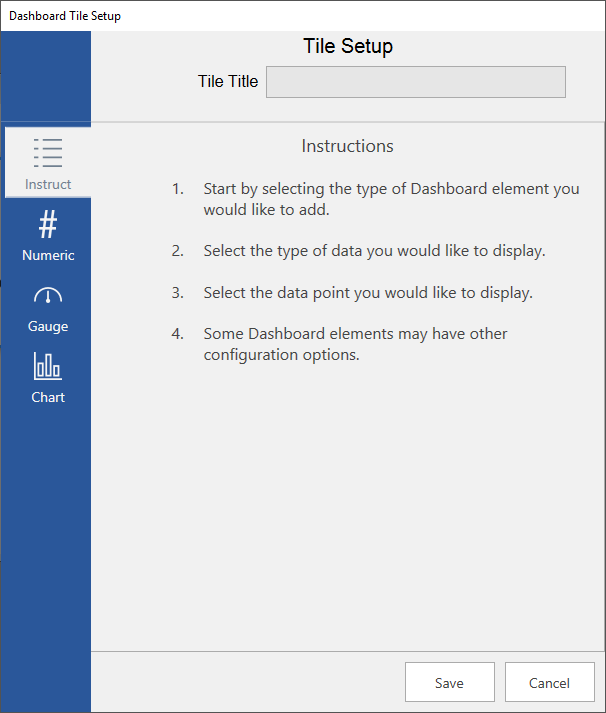
7. There are three types of Dashboards:
|
Numeric |
Displays a number; recommended for use on 1 by 1 tiles |
|
Gauge |
Creates a gauge with goals; useful for tracking progress |
|
Chart |
Displays a pie, bar, or doughnut chart; best used with 2 by 2 tiles |
8. For this example, click on Chart.
9. Use the drop-downs to select:
a. Data Set: Sales Data
b. Data Value to Display: # Sales by Associate
c. Chart Type: Pie Chart
10.
The Tile Title will automatically fill in to match selected data, but you
can change it if you like. 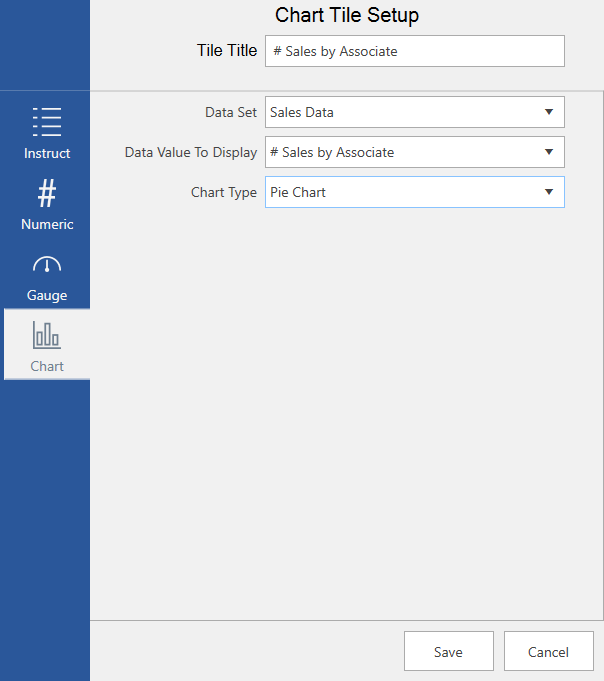
11.
Click Save to add this tile.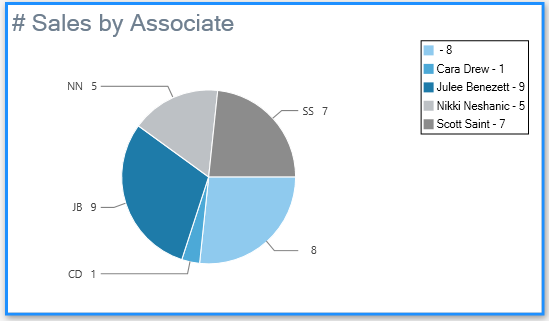
12. Repeat to add as many additional tiles as you like.
13. When done, click the Gear icon in the top right to toggle out of configuration mode.